AI Churn Prediction: The Retention Playbook That Saves Revenue Before It Leaves
The Economics of Churn Prevention
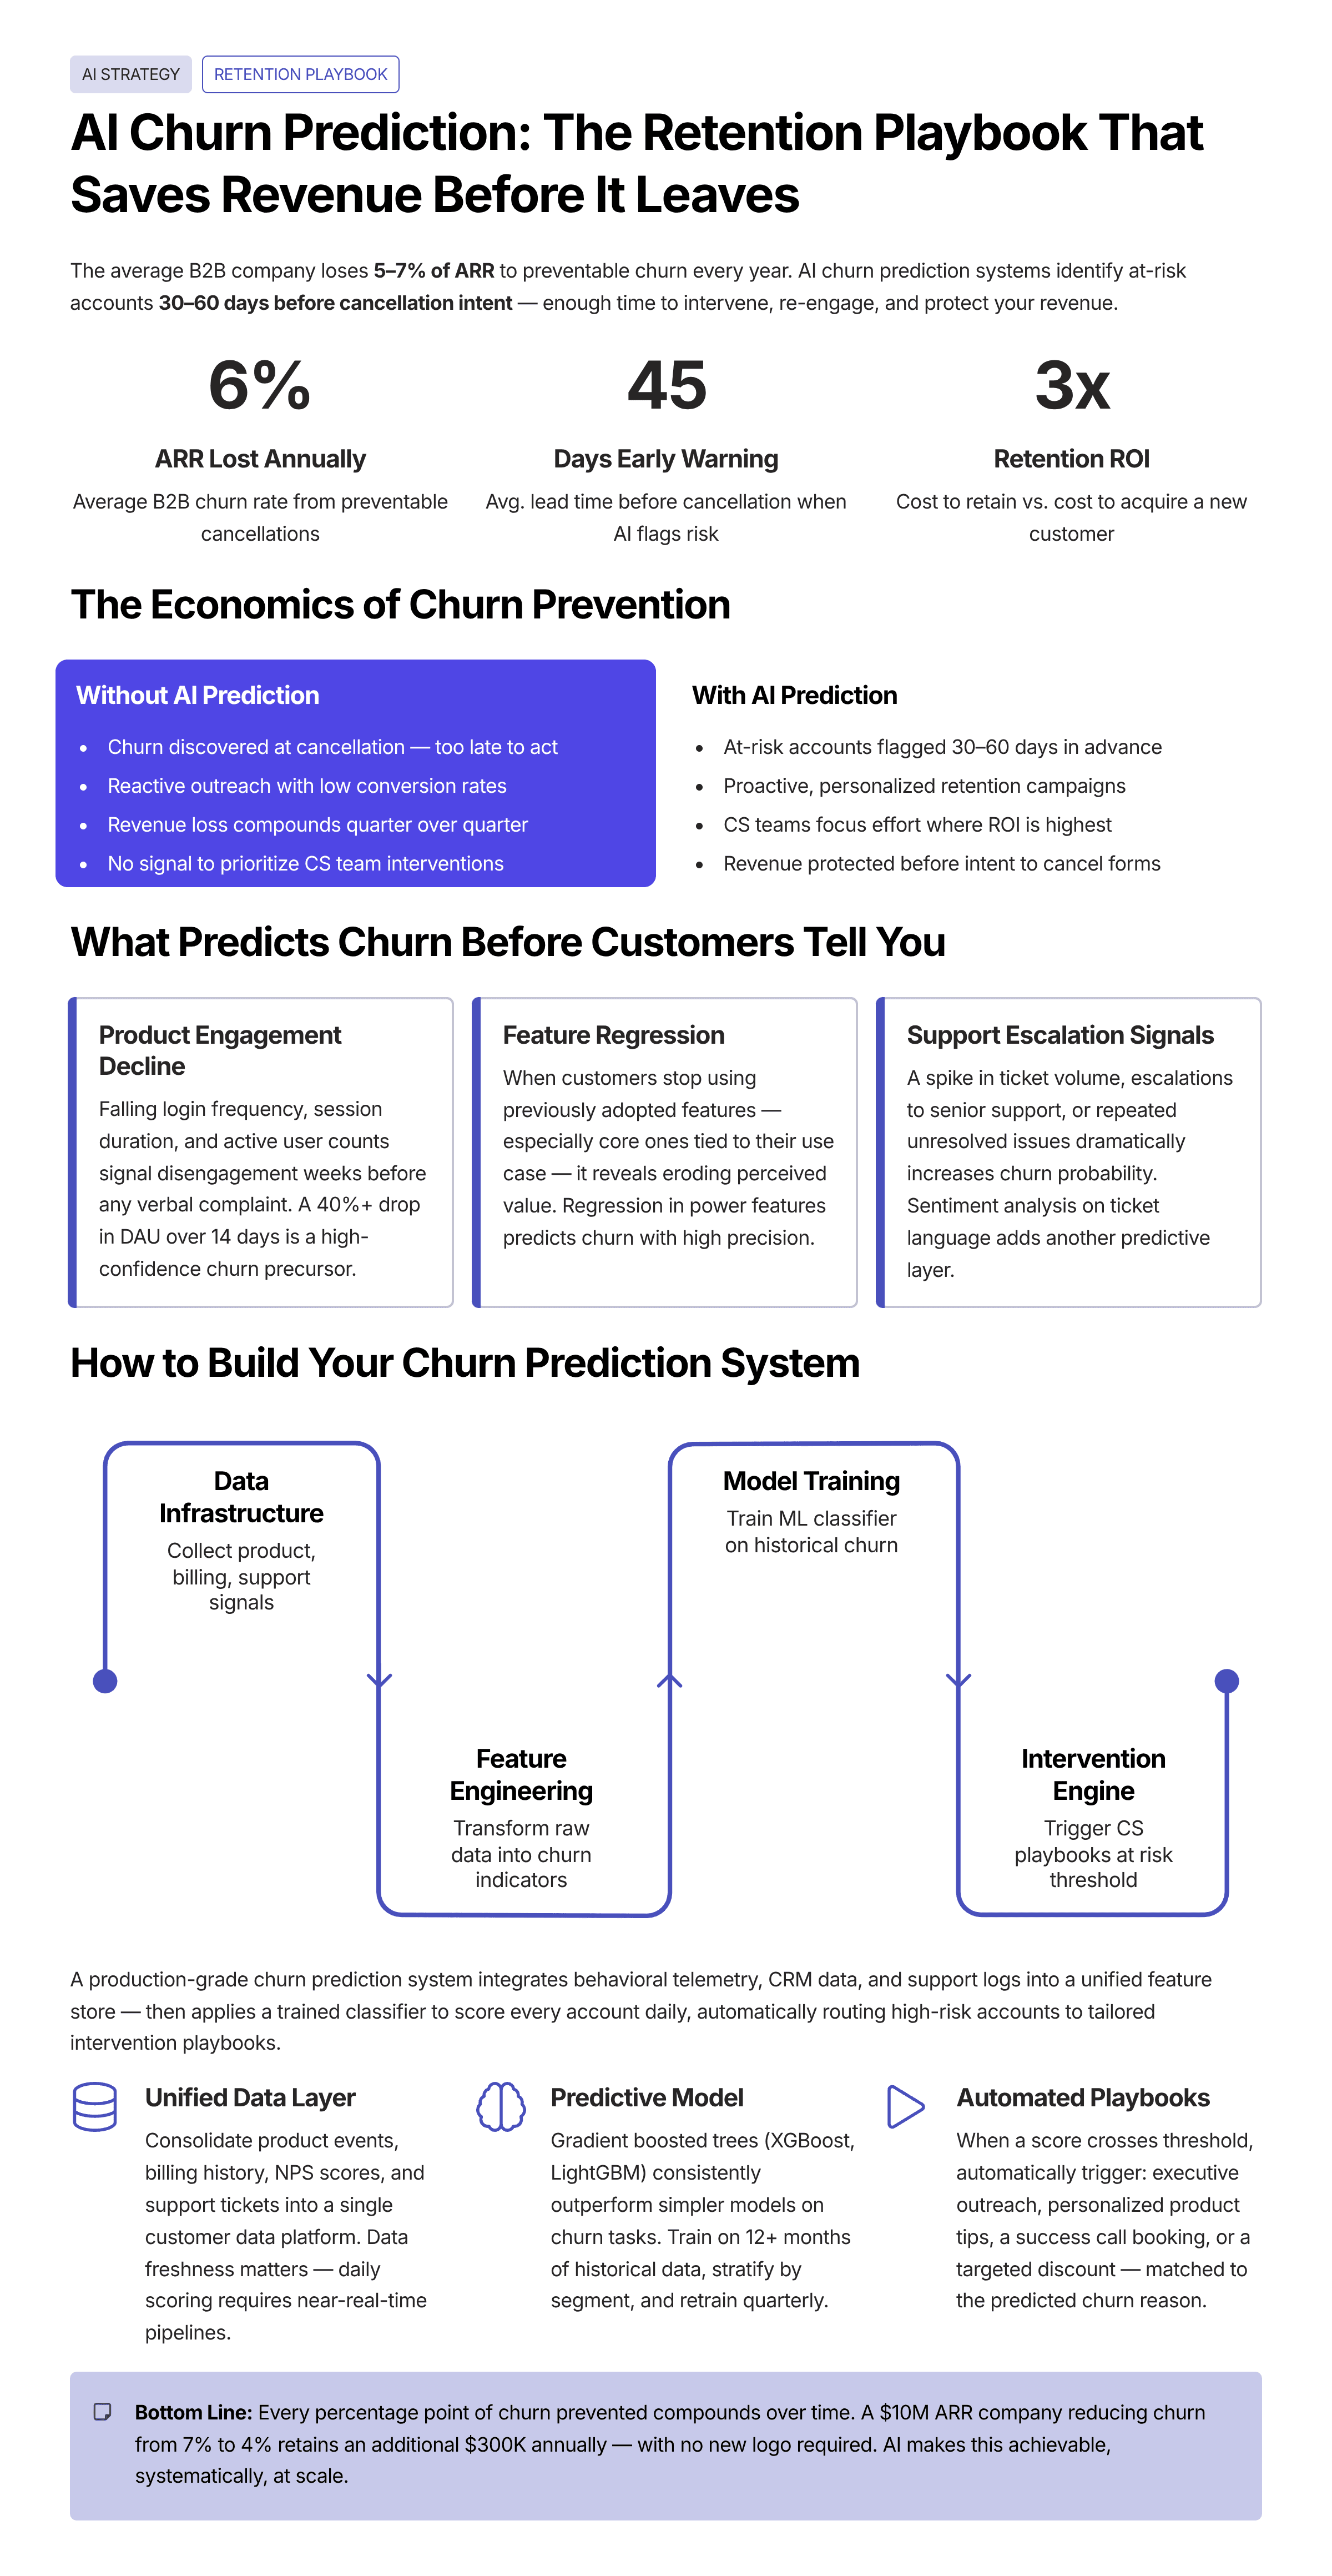
Acquiring a new customer costs 5-7× more than retaining an existing one. For a $5M ARR SaaS company with 6% annual churn, that's $300,000 in ARR lost every year — plus the acquisition cost to replace it. If you can reduce churn from 6% to 4%, you've added $100,000 in retained ARR. That's the ROI case for building a prediction system.
What Predicts Churn (Before Customers Tell You)
The signals exist in your data weeks before a customer cancels. The most reliable leading indicators across B2B categories:
- Product engagement decline: Login frequency dropping more than 40% vs. the previous 30 days
- Feature regression: Customer stops using your highest-value features
- Support escalation: Multiple unresolved tickets in a short window
- Stakeholder departure: Your champion leaves the company (trackable via LinkedIn alerts)
- Payment friction: Failed payment attempts, downgrade conversations
- Engagement silence: No response to QBR invites, renewal-stage emails
Building the Prediction System
Data Layer
Aggregate product usage data (from your backend database or tools like Mixpanel/Amplitude), CRM data (deal history, renewal dates, health scores), and support data (Zendesk/Intercom) into a unified score calculation. For most mid-market companies, this can be done in n8n or via a simple Python script running on a schedule — you don't need a data warehouse on day one.
Scoring Model
At the simplest level, weight each signal and sum them into a 0-100 health score. More sophisticated implementations use a logistic regression or gradient boosting model trained on your historical churn data. Either way, an account dropping below a threshold (e.g., 50) triggers an automated intervention workflow.
Intervention Playbooks
Score 40-60 → Trigger automated "check-in" email sequence from CSM. Score 20-40 → Slack alert to CSM with context card; schedule QBR. Score < 20 → Executive sponsor alert; pause expansion outreach; initiate save playbook.
The n8n Workflow for Automated Health Monitoring
[Schedule Trigger: daily at 8am]
  → [HTTP: Pull usage data from your product API]
  → [HTTP: Pull support tickets from Zendesk]
  → [HTTP: Pull CRM health from HubSpot]
  → [Code Node: Calculate composite health score]
  → [IF: score < threshold]
      → [HubSpot: Update health score property]
      → [Slack: Alert assigned CSM with context]
      → [Gmail: Trigger intervention sequence]
What "Good" Looks Like
A well-implemented churn prediction system typically yields a 15-25% reduction in preventable churn within 90 days of deployment. The exact number depends on your product, your intervention quality, and how early you're catching the signals. The system itself takes 2-3 weeks to architect and deploy — the ROI case closes in the first renewal cycle.